

Hitting by Position, 2023

The first obvious thing to look at is the positional totals for 2023, with the data coming from Baseball-Reference. "MLB” is the overall total for MLB, which is not the same as the sum of all the positions here, as pinch-hitters and runners are not included in those. “POS” is the MLB totals minus the pitcher totals, yielding the composite performance by non-pitchers. “PADJ” is the position adjustment, which is the position RG divided by the total for all positions, including pitchers (but excluding pinch hitters). “LPADJ” is the long-term offensive positional adjustment, based on 2010-2019 data. The rows “79” and “3D” are the combined corner outfield and 1B/DH totals, respectively:
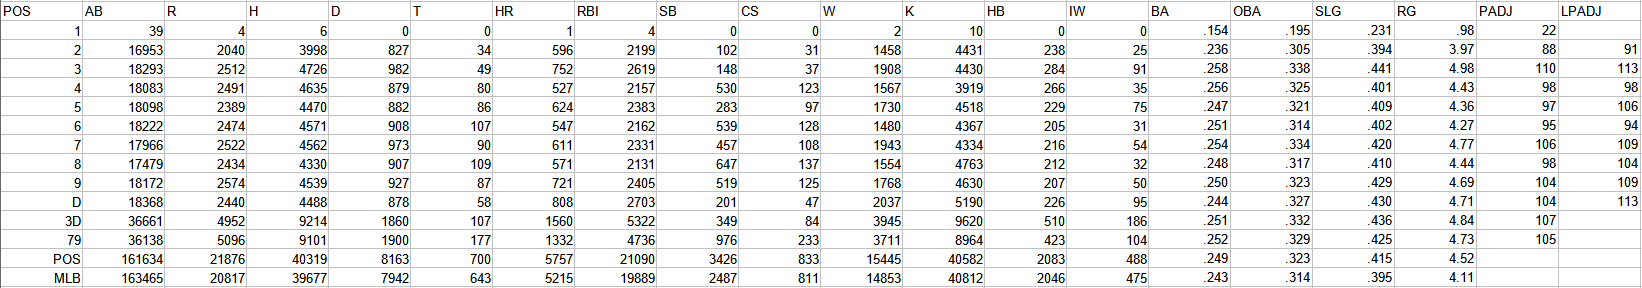
It is always hazardous (yet tempting) to attempt to draw any conclusions from one year of data. Take third base for instance, which plummeted from a 105 PADJ in 2022 to 97 in 2023 (albeit with a very slightly higher RG, 4.36 to 4.33, as the league average jumped up). The 2023 results do stand out for coming very close to ordinally matching the defensive spectrum (assuming one ignores DH, which is something of a special case due to often not being a set position and being a haven for players with short or long-term physical ailments), which is not always the case.
The teams with the best performance at each position (in terms of runs above average, with all team figures from this point forward in the post being park-adjusted. The RAA figures for each position are baselined against the overall major league average RG for the position, except for left field and right field which are pooled):
C—MIL, 1B—TB, 2B—MIA, 3B—CLE, SS—TEX, LF—SD, CF—CHN, RF—ATL, DH—LAA
The only position leader that struck me as surprising was the Brewers catchers. William Contreras led the way batting .294/.377/.455 over 470 PA, but Victor Caratini also chipped in with .265/.333/.393 over 216.
The worst team RAAs at each position were as follows, with the player listed being the one who started the most games at that position (not always the primary culprit for the league-worse performance):

The next table shows the correlation (r) between each team’s RG for each position (excluding pitchers) and the long-term position adjustment (using pooled 1B/DH and LF/RF). A high correlation indicates that a team’s offense tended to come from positions that you would expect it to:

I think the .91 for Pittsburgh is the highest correlation I’ve seen. The Pirates got less than 3 RG out of second base, shortstop, and catcher, in descending order.
The following tables, broken out by division, display RAA for each position, with teams sorted by the sum of positional RAA. Positions with negative RAA are in red, and positions that are +/-20 RAA are bolded:
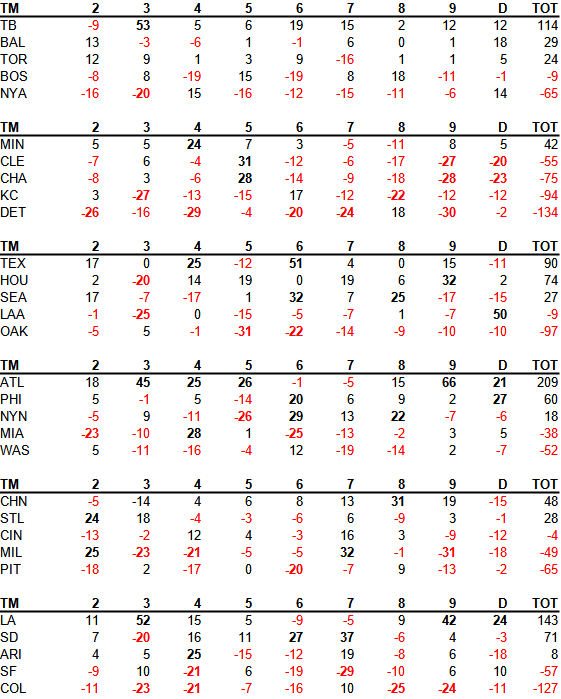
* Atlanta pulled off the mean feat of leading MLB in both infield and outfield RAA, while Colorado was last in the NL in both.
* Four of the five least productive outfields in MLB resided in the AL Central, with the White Sox bringing up the rear. Detroit was the “best” of that sorry quartet but compensated by rolling out the least productive infield in MLB, as well as the least productive catchers.
* It is fairly shocking to see all that red on the Yankees line, with only second base and DH being above league average. Aaron Judge splitting his time across center, right, and DH diluted his contributions enough that only the latter position was above-average, despite Judge having at least a 975 OPS while playing each position.
A spreadsheet with the data by position is available here.