
Hitting by Position, 2022
Hitting by Position, 2022

The first obvious thing to look at is the positional totals for 2021, with the data coming from Baseball-Reference. "MLB” is the overall total for MLB, which is not the same as the sum of all the positions here, as pinch-hitters and runners are not included in those. “POS” is the MLB totals minus the pitcher totals, yielding the composite performance by non-pitchers. “PADJ” is the position adjustment, which is the position RG divided by the total for all positions, including pitchers (but excluding pinch hitters). “LPADJ” is the long-term offensive positional adjustment, based on 2010-2019 data. The rows “79” and “3D” are the combined corner outfield and 1B/DH totals, respectively:
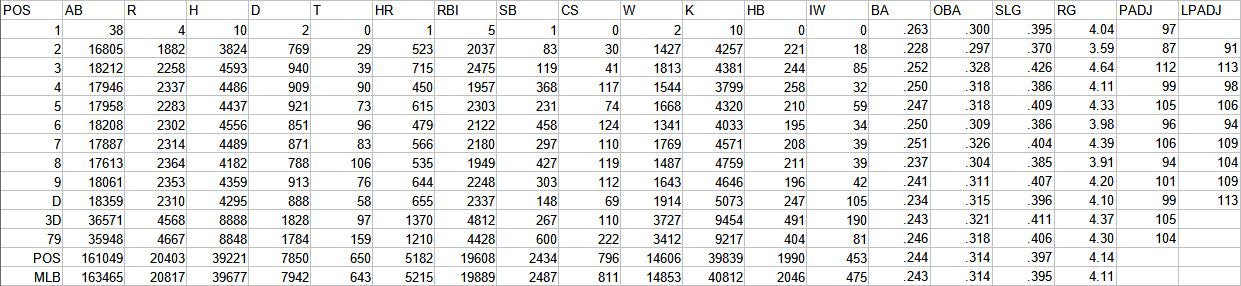
I am honestly not sure how which plate appearances are being classified as pitchers. It is immediately apparent that Shohei Ohtani’s plate appearances taken as a starting pitcher are not counted, which was a bit disappointing because I thought that for the first time since the days of Guy Hecker and Charley Ferguson that pitchers might make a bid to be a position providing credible offense (even if due to the herculean efforts of one man). However, for the forty plate appearances that were classified as taken by pitchers across MLB, they did turn in a respectable .263/.300/.395 batting line (my suspicion is that most of these were position players who had pitched in a mop-up role and then subsequently took a plate appearance).
Otherwise, positions generally put up a good match for their long-term averages with the most notable exceptions being poor performances by center fielders and DHs. While I would caution drawing too many conclusions from one year averages, center field is a bit of a trend as in 2019 they were at a 98 PADJ, 99 in 2021, and now dropping further to 94.
Traditionally the next table in this post has been a table of pitcher hitting performance, but I am not sad to be able to forever omit that eyesore. The teams with the best performance (in terms of runs above average, with all team figures from this point forward in the post being park-adjusted. The RAA figures for each position are baselined against the overall major league average RG for the position, except for left field and right field which are pooled):
C—ATL,1B—STL, 2B—HOU, 3B—STL, SS—LA, LF—SF, CF—NYN, RF—NYA, DH—PHI
Most of these are pretty self-explanatory in terms of identifying the individual primarily responsible for leading their team to the best showing, with the exception (at least for me) of the Giants left fielders who last time I checked no longer include Barry Bonds. Joc Pederson was the primary left fielder, starting 84 games with no other Giant over 24. It is also a little interesting to see that the Braves had the top hitting catchers in MLB and then acquired one of the most sought after players on the trade market to take over that position.
The worst team RAAs at each position were as follows, with the player listed being the one who started the most games at that position:
The A’s had impressive feat with four of the worst hitting positions, and as we’ll see below they had an additional position (first base) that was -20 runs while their only above-average position was anchored by Sean Murphy who was alluded to above. The Angels finishing last at first base the year after releasing Albert Pujols due to Jared Walsh’s great start is pretty representative of how things have gone over the last decade for that franchise (note, I’m not second-guessing that decision which seemed reasonable enough at the time).
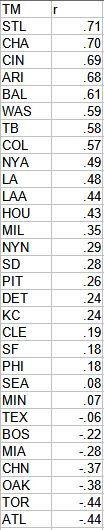
The next table shows the correlation (r) between each team’s RG for each position (excluding pitchers) and the long-term position adjustment (using pooled 1B/DH and LF/RF). A high correlation indicates that a team’s offense tended to come from positions that you would expect it to:
The following tables, broken out by division, display RAA for each position, with teams sorted by the sum of positional RAA. Positions with negative RAA are in red, and positions that are +/-20 RAA are bolded:
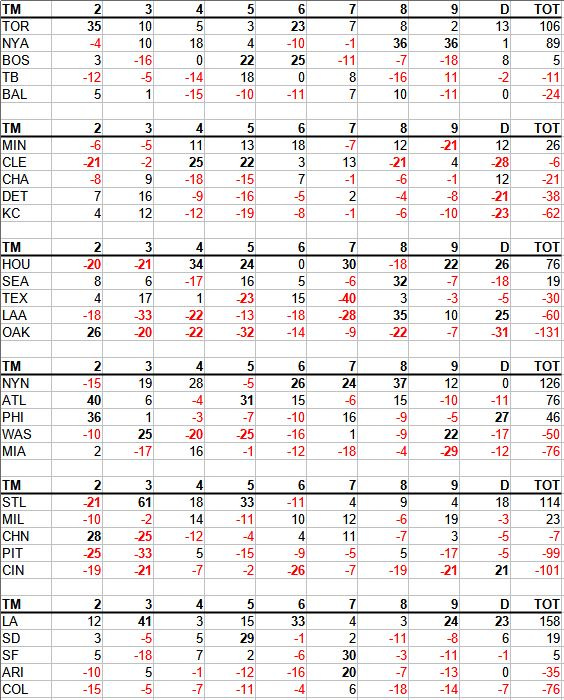
* Almost every position for Houston qualified as extreme, with catcher, first base, and left field (almost) on the negative side. The only exception was their shortstops who would then be major contributors in the postseason.
* Texas left fielders were the worst single position in MLB in terms of RG (the rate of run creation without comparing to the overall performance of the position), which helped lead their outfield to the lowest RAA in the AL. Miami had the worst overall outfield RAA in the majors.
* The Cardinals had the top infield production in MLB, but it came from the corners which contributed to them leading in correlation between long-term position adjustment and production by position. The Reds got the least infield production in the NL.
* I was surprised to see that Cleveland led the AL in infield RAA, but Andres Gimenez and Jose Ramirez led strong showings from second and third while first base and shortstop netted out to average. Four NL infields matched or exceeded the Guards’ production.
* The top two outfields were both in New York, with the Mets edging the Yankees in RAA with strong showings from each position, while the Yankees got 72 total RAA out of Judge-anchored center and right but only average production from left field.
The full spreadsheet is available here.