

Crude Team Ratings, 2024

Crude Team Rating (CTR) is my name for a simple methodology of ranking teams based on their win ratio (or estimated win ratio) and their opponents’ win ratios. A full explanation of the methodology is here, but briefly:
1) Start with a win ratio figure for each team. It could be actual win ratio, or an estimated win ratio.
2) Figure the average win ratio of the team’s opponents.
3) Adjust for strength of schedule, resulting in a new set of ratings.
4) Begin the process again. Repeat until the ratings stabilize.
The resulting rating, CTR, is an adjusted win/loss ratio rescaled so that the majors’ arithmetic average is 100. The ratings can be used to directly estimate W% against a given opponent (without home field advantage for either side); a team with a CTR of 120 should win 60% of games against a team with a CTR of 80 (120/(120 + 80)).
First, CTR based on actual wins and losses. In the table, “aW%” is the winning percentage equivalent implied by the CTR and “SOS” is the measure of strength of schedule--the average CTR of a team’s opponents. The rank columns provide each team’s rank in CTR and SOS:

The playoff teams hold down 12 of the top 13 spots, which is pretty common as CTR simply reflects actual W% with adjustment for strength of schedule. However, it is not every year in a 12 team playoff that the #6 ranked team in MLB misses the playoffs. Arizona had the misfortune of being in a division with the #1 and #3 ranked teams, and in the better league, as seen when looking at the average aW% by division:

As an unapologetic AL partisan I am going to move quickly past the fact that the NL has now had a higher rating than the AL for four of the past five seasons.
Any kind of winning percentage or winning percentage estimate can be fed into the CTR methodology, so these are the CTRs based on Expected W% - Pythagenpat using actual runs and runs allowed:

This is a good juncture to discuss the White Sox and how their CTR stacks up historically. They were of course last in MLB in CTR whether using actual, expected, or (spoiler alert) predicted W%, but their aW% of .302 using R/RA is significantly better than the .257 based on W/L, and their .318 based on RC/RCA is better still. This is unsurprising – you’d expect a team with a historically bad W/L record to be a really bad team that also was “unlucky” and won fewer games than would be expected from their underlying performance.
That actual performance resulting in the second lowest AL/NL aW% since 1900, trailing only the 1916 A’s:

However, their .302 aW% based on R/RA is only the seventh-worst:
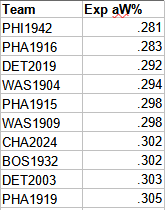
The 1942 Phillies, just off the list at .296 using actual aW%, jump to the top spot and join three other Philadelphia teams (all A’s) in the bottom ten. The 2019 Tigers remain one of the sneakiest worst teams in MLB history, as their expected aW% was the same as their actual aW%, which is a rare for the teams with the worst aW%s. In fact, of the teams that appeared on these bottom ten lists, only the 1942 Phillies and the 1915 A’s shared that dubious property. The 2019 Tigers avoided the publicity that their terrible forerunners got in 2003, but one could make a solid case that they were in fact the worst team of the expansion era.
Here are the CTRs using Predicted W% (RC/RCA):

Finally, I feel obligated to show the actual CTRs taking the playoffs into account. I am not a big fan of including the playoffs – obviously they represent additional games which provide additional information about team quality, but they are played under very different circumstances than regular season games (particular with respect to pitcher usage), and the fact that series are terminated when a team clinches biases the W-L records that emerge from series. Nonetheless, playoff inclusive CTRs are below, along with a column showing each team’s percentage change in CTR relative to the regular season W-L only version.
