
Crude Team Ratings, 2023
Crude Team Ratings, 2023

Crude Team Rating (CTR) is my name for a simple methodology of ranking teams based on their win ratio (or estimated win ratio) and their opponents’ win ratios. A full explanation of the methodology is here, but briefly:
1) Start with a win ratio figure for each team. It could be actual win ratio, or an estimated win ratio.
2) Figure the average win ratio of the team’s opponents.
3) Adjust for strength of schedule, resulting in a new set of ratings.
4) Begin the process again. Repeat until the ratings stabilize.
The resulting rating, CTR, is an adjusted win/loss ratio rescaled so that the majors’ arithmetic average is 100. The ratings can be used to directly estimate W% against a given opponent (without home field advantage for either side); a team with a CTR of 120 should win 60% of games against a team with a CTR of 80 (120/(120 + 80)).
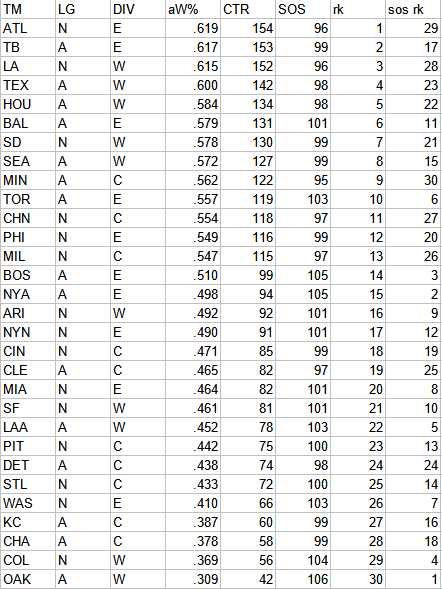
First, CTR based on actual wins and losses. In the table, “aW%” is the winning percentage equivalent implied by the CTR and “SOS” is the measure of strength of schedule--the average CTR of a team’s opponents. The rank columns provide each team’s rank in CTR and SOS:

The playoff teams hold 12 of the top 13 spots, with only #10 Seattle having missed out.
These are the average ratings for each division/league (I use aW% to aggregate the performance of multiple teams rather than CTR because the latter is expressed as a win ratio—for a simple example a 90-72 team and a 72-90 team will end up with an average win ratio of 1.025 but their composite and average winning percentages will both be .500):

For the third time in the last four seasons (selectively chosen endpoint intentional), the NL appeared to be stronger than the AL after a long period of AL domination. While the AL East was the strongest division despite their teams combining to go 0-7 in the playoffs, the AL Central fell from a 2022 low of .457 even further to .432. Its five teams ranked #12, #22, #23, #28, and #29 – essentially a division comprised of what in an evenly distributed league would be a bad second-place team, a pair of middling fourth-place teams, and two last-place teams.
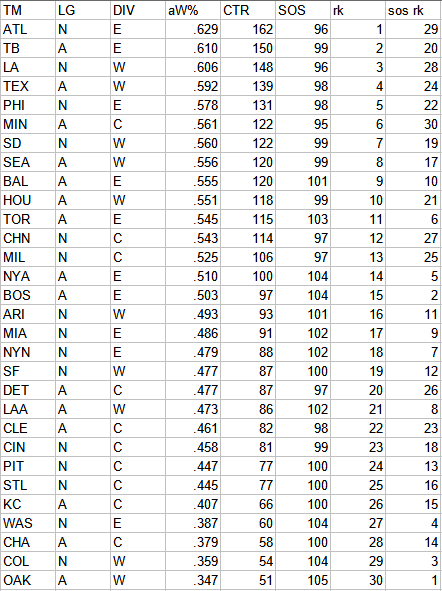
These are the CTRs using expected (runs/runs allowed) records:
And using predicted (runs created/runs created allowed) records:
I will close by reverting to CTRs based on actual W-L, but this time taking the playoffs into account. I am not a big fan of including the playoffs - obviously they represent additional games which provide additional information about team quality, but they are played under very different circumstances than regular season games (particular with respect to pitcher usage), and the fact that series are terminated when a team clinches biases the W-L records that emerge from series. Nonetheless, here they are, along with a column showing each team’s percentage change in CTR relative to the regular season W-L only version.
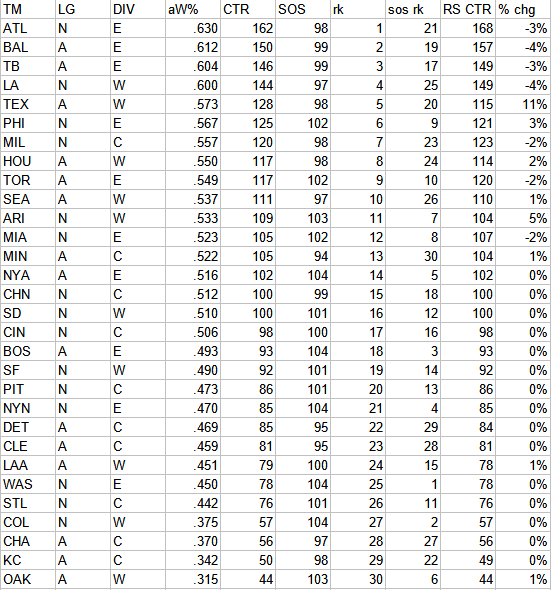
Even after taking playoff performance into account (and in a way which if anything is biased towards the winners of playoff series), the World Series only matched the #5 and #11 teams. Texas and Arizona were the two biggest risers, with Texas dramatically improving their ranking by going a combined 13-4 against #2, #3, #9, and #13 in the regular season rankings.