
Crude Team Ratings, 2022
Crude Team Ratings, 2022

Crude Team Rating (CTR) is my name for a simple methodology of ranking teams based on their win ratio (or estimated win ratio) and their opponents’ win ratios. A full explanation of the methodology is here, but briefly:
1) Start with a win ratio figure for each team. It could be actual win ratio, or an estimated win ratio.
2) Figure the average win ratio of the team’s opponents.
3) Adjust for strength of schedule, resulting in a new set of ratings.
4) Begin the process again. Repeat until the ratings stabilize.
The resulting rating, CTR, is an adjusted win/loss ratio rescaled so that the majors’ arithmetic average is 100. The ratings can be used to directly estimate W% against a given opponent (without home field advantage for either side); a team with a CTR of 120 should win 60% of games against a team with a CTR of 80 (120/(120 + 80)).
First, CTR based on actual wins and losses. In the table, “aW%” is the winning percentage equivalent implied by the CTR and “SOS” is the measure of strength of schedule--the average CTR of a team’s opponents. The rank columns provide each team’s rank in CTR and SOS:
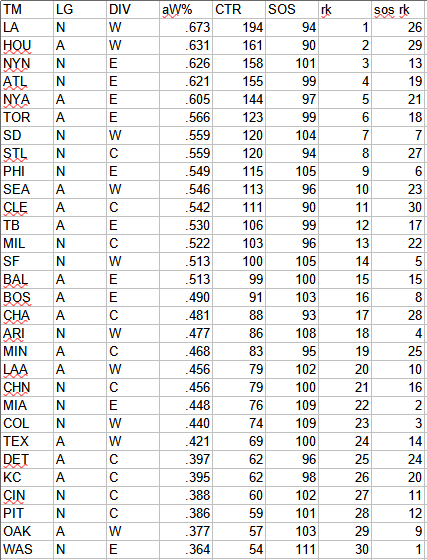
I have many issues with the new playoff format, but one thing that can be said for it in its first year is that it did result in the twelve most deserving teams qualifying, whereas previously the #9 Phillies would have been left out (along with the #12 Rays), although the team that would have qualified under the old format but not been among the top ten was the #11 Guardians playing in the other league.
These are the average ratings for each division/league (I use aW% to aggregate the performance of multiple teams rather than CTR because the latter is expressed as a win ratio—for a simple example a 90-72 team and a 72-90 team will end up with an average win ratio of 1.025 but their composite and average winning percentages will both be .500):
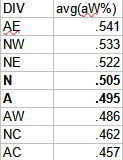
In 2019 the NL finally surpassed the AL at an average aW% of .508. I didn’t run these in 2020 for obvious reasons but in 2021, the AL retook bragging rights at .519. These can bounce around a fair deal from year-to-year; last year’s NL East (.450) was actually worse than this year’s AL Central, although the latter took a lot more grief. I think this was largely due to the fact that the big favorites flopped while in 2021 the Braves won the NL East as most expected.
It’s mildly interesting to see the toughest strength of schedule coming from the NL East and not the top-ranked AL East as typically the toughest schedule will belong to the last place team from the toughest division. However, the AL East was well-balanced, so the usual situation of a bad last place team getting roughed up by their tough divisional opponents didn’t really occur. The AL East was respectable from top (NYA, 144) to bottom (BOS, 91).
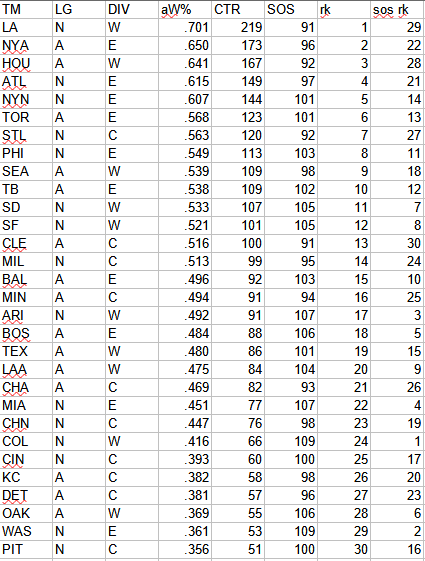
These are the CTRs using expected (runs/runs allowed) records:
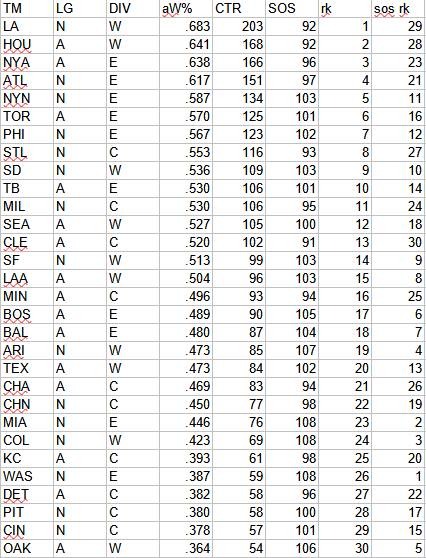
And using predicted (runs created/runs created allowed) records:
Finally, I will close by reverting to CTRs based on actual W-L, but this time taking the playoffs into account. I am not a big fan of including the playoffs - obviously they represent additional games which provide additional information about team quality, but they are played under very different circumstances than regular season games (particular with respect to pitcher usage), and the fact that series are terminated when a team clinches biases the W-L records that emerge from series. Nonetheless, here they are, along with a column showing each team’s percentage change in CTR relative to the regular season W-L only version.
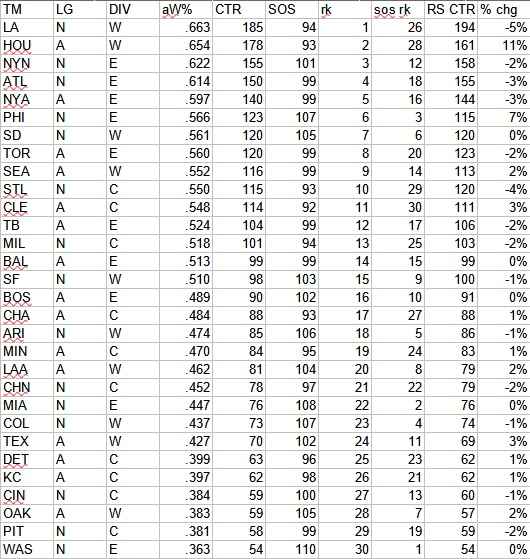
I will say that I did find the Astros rolling to the title with an 11-2 mark against three teams rated in the regular season top ten to be pretty impressive, but if even so I’d still take the Dodgers as the favorite if they re-rolled the playoffs starting tomorrow (alas, that will not be happening, and winter will proceed as previously scheduled).