

2024 Predictions

This is not a sabermetric piece (although a bare minimum of “sabermetric” considerations go into it, as described below). This is simply a fun exercise that I have been doing for as long as I’ve been a baseball fan, undertaken with the understanding that:
1) it’s going to be “wrong”
2) point estimates are not really what you would want here (so this year I’m adding equally questionable probabilities!)
3) many readers will completely ignore any such caveats and disclaimers
I do start by trying to figure out the regulars at the nine offensive positions, five starting pitchers, and four relievers, using publicly-available projections with my own subjective tweaks (usually to estimated playing time, not performance) sprinkled in, and filling in the remaining plate appearances and innings that a team would need to fill with an estimate of the level of performance that would be needed to reconcile the league totals for runs and runs allowed to where I expect them to fall out. It’s certainly less rigorous than the full-scale projections run by BP, Fangraphs, Clay Davenport, etc., but more rigorous than simply blindly guessing. I also consider the projections produced by the three outlets I named to see if anything jumps out that the more crude approach is missing.
Despite this attempt at rigor, all you really need to know about what follows is that last year in this space I wrote: “I already cited Baltimore as the team most likely to underperform mainstream expectations, but Texas is right there with them.” Ouch. This actually isn’t as bad as I recalled it being – I thought I had cited Philadelphia as well.
The rank order list below is my own, generally following my crude estimates but overridden if I feel appropriate. The more interesting part is at the bottom, where I’ll show some the crude win total estimates and corresponding playoff probabilities.
NL EAST
1. Atlanta
2. Philadelphia (wildcard)
3. New York
4. Miami
5. Washington
I have Atlanta projected as the best offensive and defensive team in the NL, although the differences are very small (two and six, both with the Dodgers runners up). Thus the choice between the Braves and Dodgers for the pennant and World Series winner is a coin flip. I’ll stick with Atlanta although I do question whether farm system depth could be the decisive factor in favor of Los Angeles. Philadelphia remains a team that is overrated in the public’s eye because of their NLDS reversals against Atlanta, but this year I think they do stand out as the #3 team in the NL as the Mets and Padres are no longer even paper tigers. That being said, I think the odds are better than 50/50 that one of the Mets and Marlins gets a wildcard berth, although Miami’s pitching situation at this late date is concerning. Washington projects as the worst team in the NL in a tight race with Colorado.
NL CENTRAL
1. St. Louis
2. Chicago
3. Cincinnati
4. Milwaukee
5. Pittsburgh
With the Brewers shedding their aces, this division has lost the only thing that prevented it from giving off the vibes that it’s junior circuit cousin did in 2023. The Cardinals return to the projected top spot, with the Cubs and Reds in shouting distance and the Brewers and the Pirates needing more breaks to go their way. Despite bringing in a gaggle of veteran starters, St. Louis projects as only average defensively, and as I write this the injuries mount to their offensive players. But even after trading Tyler O’Neill they seem to have an endless supply of mediocre – slightly above average vaguely generic outfielders, the aging infield cornerstones could rebound, Jordan Walker could break out...there’s enough to like to give them a slight edge. The Cubs and Reds maintain much of what distinguished them last year – in the former case, a group of useful pitchers similar to my description of the Cardinals’ outfielders, in the Reds case a now-injury reduced gaggle of talented young infielders. Playing in this division means that the Brewers and the Pirates still have a shot; contrast their division title probability below and their mean win estimate with those of the Giants and the Marlins for instance.
NL WEST
1. Los Angeles
2. Arizona (wildcard)
3. San Diego (wildcard)
4. San Francisco
5. Colorado
The Dodgers remain comfortable division favorites, although it’s easy to imagine a bunch of “What’s Wrong With the Dodgers?” pieces being written if they do anything less than win 105 games and the World Series, despite there being nothing wrong with the Dodgers. It’s also easy to imagine the Diamondbacks being considered a disappointment despite improving over 2023, as they now project to actually deserve the record they had with a negative run differential last year. The Padres’ trade for Dylan Cease not only allowed them to edge past the Cubs on paper for the last wildcard spot, but took away my ability to mention them as a potential sleeper team. I felt they were overhyped last year but were well on their way to being overlooked this year. The Giants don’t project to be a very strong offense, adding to the weird vibes that seemingly surround the organization with the well-publicized free agent misses, the dismissal of Gabe Kapler, the release of JD Davis, etc. Maybe there is a price to pay for 2021 after all. The Rockies don’t project as the very worst team in the NL, but it certainly feels like there’s much more reason to hope that the Nationals might surprise.
AL EAST
1. New York
2. Toronto (wildcard)
3. Baltimore (wildcard)
4. Tampa Bay
5. Boston
This is a tough division to forecast as only one win separates the top three. New York has the best offense in the division although I am wary that they traded much of their starting pitching depth to get it (by getting Juan Soto). I have been burned by picking Toronto repeatedly over the last few years; while they have delivered a couple wildcards, they have not broken through with a division title. Baltimore still seems like a regression candidate to me, but some of that is offset by the potential for more young talent to break through. Still, it’s easy to look at a team that has young stars and won 100 games and overlook things that would normally be red flags for a step back. I would probably have Tampa Bay as a co-favorite in the Central, but a team that is good on paper will finish fourth in this division. Boston is not your average last-place picked team and certainly could make noise as they did in the first half of 2023.
AL CENTRAL
1. Cleveland
2. Minnesota
3. Detroit
4. Kansas City
5. Chicago
I am usually loathe to pick my own team unless it’s a no-brainer, but the more I look at this the more I think the Guards should be the favorites. Minnesota’s starting pitching is not what it was in 2022 and while Cleveland has a few injury concerns on the staff, the Twins’ appear to be worse. While it would be surprising to see it happen before the Super-2 deadline, Kyle Manzardo and Chase DeLauter could both provide an offensive boost. I don’t think the Guardians are odds-on favorites; the 40% chance I show below feels about right. I am out on a limb here, which I don’t like – PECOTA has 20%, Fangraphs 19%, Clay Davenport 22%.
I do think the Cleveland is being overlooked by some non-quantitative predictors, who are impressed by veterans brought in by Detroit and Kansas City. Stranger things have happened, and this division certainly gives hope, but I don’t think that Adam Frazier, Hunter Renfroe, Michael Wacha, and Seth Lugo really move the needle that much. Cole Ragans’ breakout being real would mean much for the Royals than those additions individually. But I think those teams project worse on offense and defense than Cleveland and Minnesota by at least twenty runs on each side of the ball. The White Sox are my pick for the worst record in MLB.
AL WEST
1. Houston
2. Seattle (wildcard)
3. Texas
4. Los Angeles
5. Oakland
Houston is still the best team in the AL on paper, by a few games – in fact, my estimates rank them right with Atlanta and the Dodgers as the best team in baseball, which subjectively feels a bit optimistic. But I do have them projected as both the best offense and defense in the circuit, and you can’t pick against that. Seattle and Texas are essentially even on paper, which would make me want to pick the former just as a protest against the halo effect that envelops the World Series winner and makes people retcon the season so as to have made their victory seem inevitable. Only a tiny margin separated them in the standings last season, and while Texas’ second- and third-order performance were stronger, they don’t project to be a particularly strong defensive team this season and I think a sober assessment of the age and injury history of their pitching backs that up. Los Angeles is a hard team for me to evaluate – it feels like they have a bunch of young talent, but how much of that is an illusion created by how aggressively they have been promoting their (mostly) college draftees? When you see players ascend to the majors that quickly you can be fooled into thinking they are future stars rather than maybe just solid regulars being hustled along – it does seem like the latter is a better description of a Zack Neto or Nolan Schanuel than the former. I am hoping that Oakland gets off to a decent start (except for the four-game opening set with Cleveland) so that we don’t have to sit through a redux of last year’s overly dramatic pronouncements about historically bad they were.
WORLD SERIES
Atlanta over Houston
This year, at the last minute, I decided to throw together some playoff odds based on my projected win totals. I was sparked to do this by the linked Tweet below, as I agreed it with and Tom did a better job of articulating what has always bugged me about playoff odds: they simulate the season assuming fixed playing time and fixed talent level, but in fact those are two of the key variables. I don’t have an answer for that here – but my approach naturally pulls team’s expected wins closer to .500 than the serious projections I’ve referenced a few times do.
https://twitter.com/tangotiger/status/1769177471054754023
It had occurred to me before how easy it would be to turn a projected win total into a crude Monte Carlo simulation, but because I don’t put a lot of stock in these win estimates I never bothered. To make it easy, I just worried about team’s relative positions and not forcing the league win total for a given “simulation” to balance. I split it up by leagues, fifteen teams at a time, and each team got 10,000 random numbers to map to a number of wins using the normal distribution. Even though team wins should follow a binomial distribution, the central limit theorem gives us license for this. I somewhat arbitrarily set the standard deviation to 8 wins. Theoretically, for a .500 team the standard deviation of team wins is SQRT(162*.5*(1-.5)) = 6.36. But we are dealing with uncertainty around the team’s actual strength, exacerbated by what injuries and other unknowns would do even if we had perfect estimates of each player’s rate of performance. If anything I should have made it higher, and in the future I might use actual errors of these preseason estimates to come up with a value to use.
I also added another kludge which is less justifiable, which to apply a normal distribution with standard deviation = 4, with the mean equal to the projected wins for each team, for each of the 10,000 runs. I meant this to represent some of the uncertainty around the true team quality, but it’s not quite right – teams should in general be drawn closer to .500. This actually results in more extremes than it other wise might – across my 10,000 draws Houston maxed out at 124 wins.
In any event, I thought the final probabilities seemed reasonable, although I hope it is clear from my description that I think the methodology – both of the underlying win estimates and the subsequently arising probabilities – leaves much to be desired. For each of the 10,000 “seasons” thus simulated, I simply picked the team with the highest win total as division champ, ranked the division champs 1-3, and ranked the three highest win totals for non-division champs as 4-6 to give me playoff seedings.
Then I took a big shortcut to get pennant and World Series odds that understates differences across teams, which was to assume that each playoff seed had a fixed probability to win the pennant based solely on the playoff structure itself, assuming that all teams were .500 teams entering the playoffs. I just used my playoff odds model and set all team ratings to 100:
For the World Series, I assumed that the higher seed in their league would have home field, and then averaged the probability of winning across the two #1 seeds (these weren’t identical as I arbitrarily assumed that one league’s seed would always have home field advantage over their same-seeded opposite). I just uniformly applied these percentages to the probability that each team would earn a particular seed and called it a day.
One thing I’m showing in these estimates that you don’t usually see is the probability of each team having the best record in their league. Since I actually in theory value this more than a playoff pennant, why not act like it by paying attention to it? Of course, you can also see how those are much more likely to be achieved by the assumed “actual” best team than the pennant (with the caveat that the pennant methodology does artificially flatten differences in team quality).
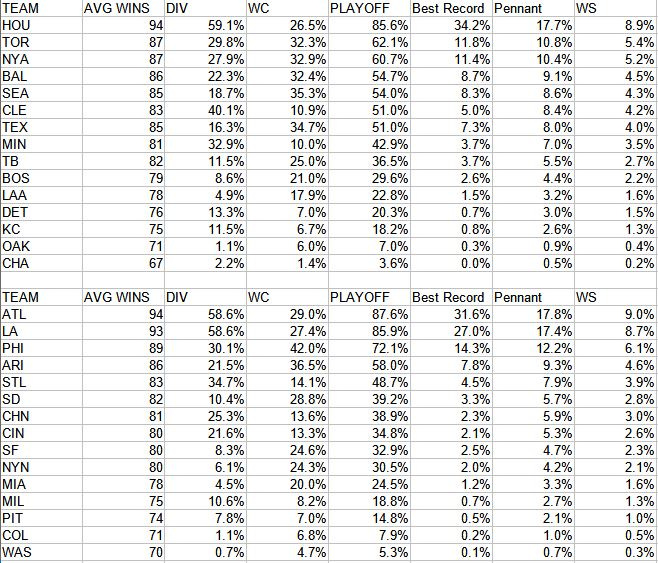
I showed a decimal place on the percentages only because I didn’t want to show 0% for any probability; I certainly do not claim these are accurate to anything approaching that level of precision. I think looking at the playoff odds in this way viscerally illustrates how much more conservative my win totals as a result of my methodology. I project Oakland for 71 wins while Clay Davenport projects them for 64. I am not quibbling with Davenport’s estimate – I would certainly bet under 71 if I had to put money on it. Seven wins may not seem like a bunch, but it makes a huge difference when looking at playoff probabilities as I have Oakland at 7.3% and Davenport has them at 1.2% (which itself is more generous than PECOTA, which is why I’m using his estimates for the comparison). With the caveat that they play in very different divisions, if you look at the teams Davenport projects closest to 71 wins (ChiSox at 68, Pittsburgh at 73, Kansas City at 74), they have broadly similar playoff odds to what I give the A’s (3.9%, 11.4%, 13.3%). So I think saying a team that projects to 71 wins would have a 7.3% playoff chance is fairly reasonable – the real point of contention is whether they project to that many wins or not.
I imagine it’s possible someone might look at the lowest odds of winning the World Series being 0.2% and think that’s too high. Setting aside the type of argument above about how good that team should project to me, let’s suppose for ease of discussion that the projected worst team in MLB (I will slip to just calling them the worst team without the projected distinction, but of course that’s crucial) typically had a 0.2% of winning the World Series using a comparable methodology throughout history. At 0.2%, you would expect that the worst team would win the World Series once every 500 seasons. There have only been 119 World Series, so the probability that this would not have happened is 79%.
Many people, presented with the nugget that “this has never happened before in 119 seasons” would say that it is therefore impossible. I would suggest that this is simply a failure to recognize what 0.2% actually means. It also points to the playoff title being more subject to randomness than the best regular season record is; the 0% probability I show for the ChiSox having the best record in the AL is actually 0.02% - in 2 of the 10,000 simulations, they had the best record in the AL. In those two simulations, #2301 and #8111, they were bumped up to a true talent level of 74 and 75 wins respectively, then ended up with 93 and 94 simulated wins. But their probability of winning the pennant is 24 times higher than their probability of having the best record, as they are assumed to have some probability to win the pennant when they stumble into the playoffs as the #6 seed, as they did in 84 simulations, including #3510 in which they have just 79 wins.